Hello, this is another FAQ (Frequently Asked Questions) tutorial - this one covers debugging. Many of you have requested a proper tutorial on debugging, so I have decided to write one in great detail.
This tutorial assumes that you are using OpenJK and Visual Studio. Some of the aspects may be similar on Mac using xcode. I will be using Visual Studio 2013 and the WIP JK2 SP code from OpenJK as an example, since I have it readily available.
For the duration of this tutorial, make sure your project is in the Debug configuration. You can check which configuration you're in currently by looking at the drop-down menu next to the green arrow (or next to "Local Windows Debugger" if you're using VS2012+)
Some Initial Settings
Before you begin debugging, you will need to do some basic housekeeping on your generated projects. This needs to be done every time you regenerate your projects using CMake or the .bat script.
On each of your projects in the Solution Explorer, right click on a project, and select properties (or press Alt+Enter). You will see a large dialog box open with many different options. On the left, you will find the "C/C++" category. Expand it, and click on the General tab. There will be an option within this panel saying "Debug Information Format". Make sure this is set to "Program Database for Edit And Continue (/ZI)":
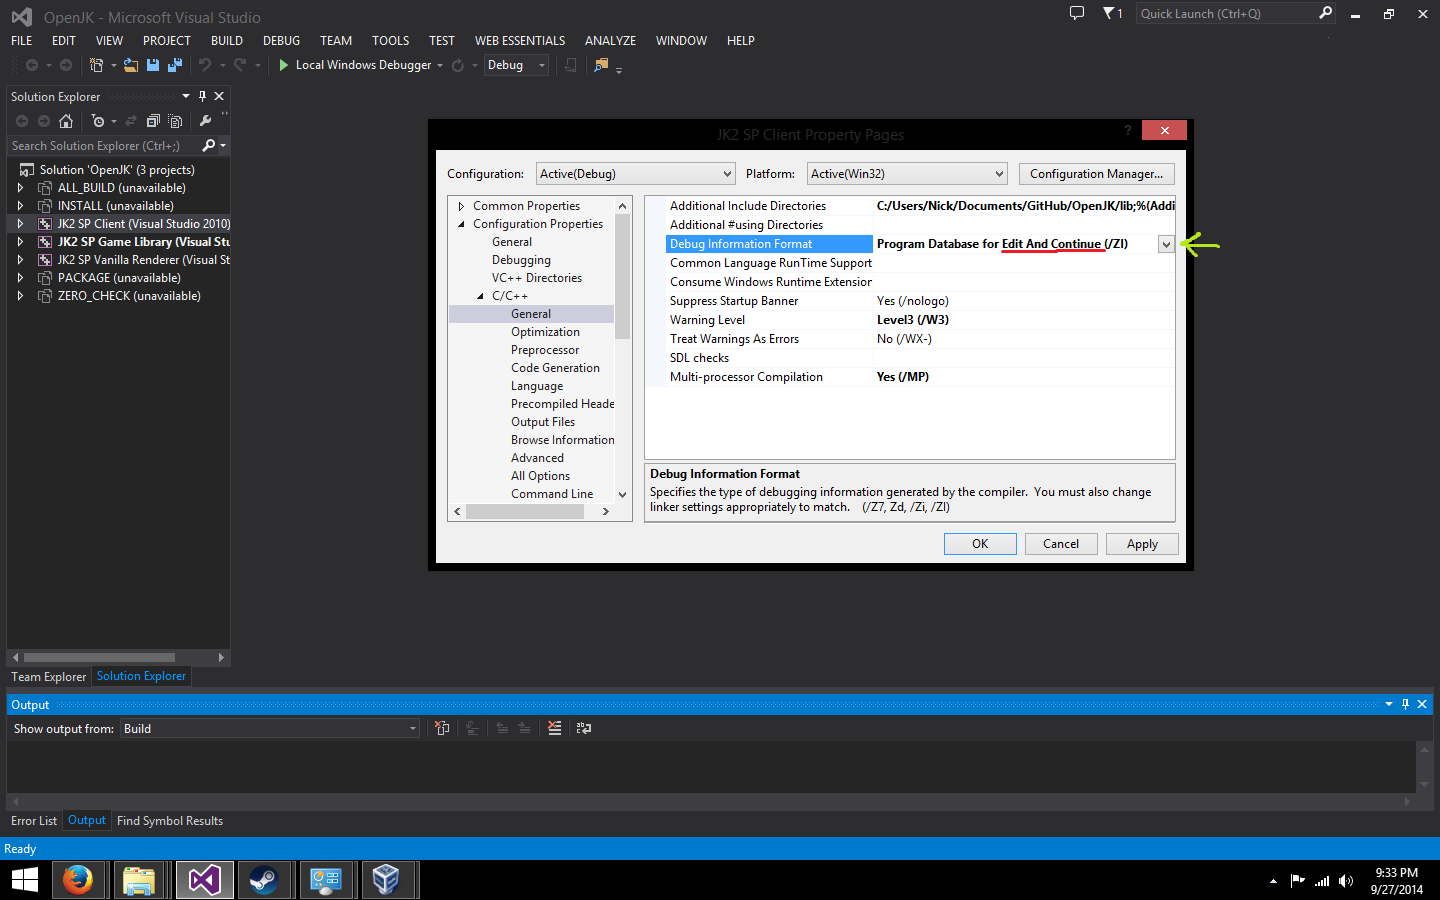
When you turn this option on, it allows you to change the code while the program is paused, and continue to run with your newly-modified code. Apply this setting to every project.
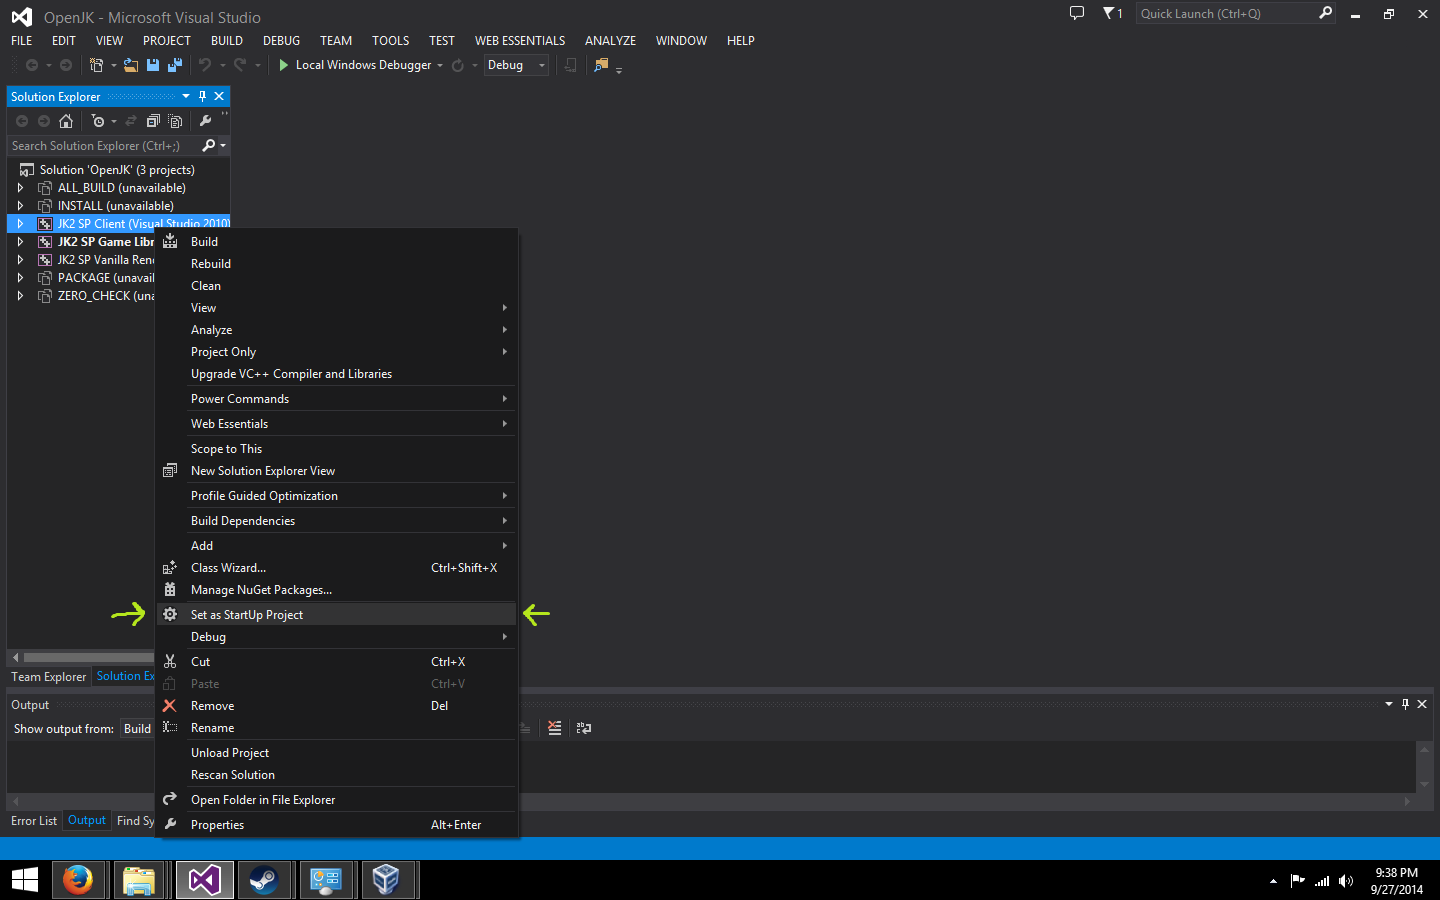
Now you need to tell the debugger to run the correct executable. Right click on the correct project ("SP Client", "MP Client", "JK2 SP Client") and hit "Set As Startup Project".
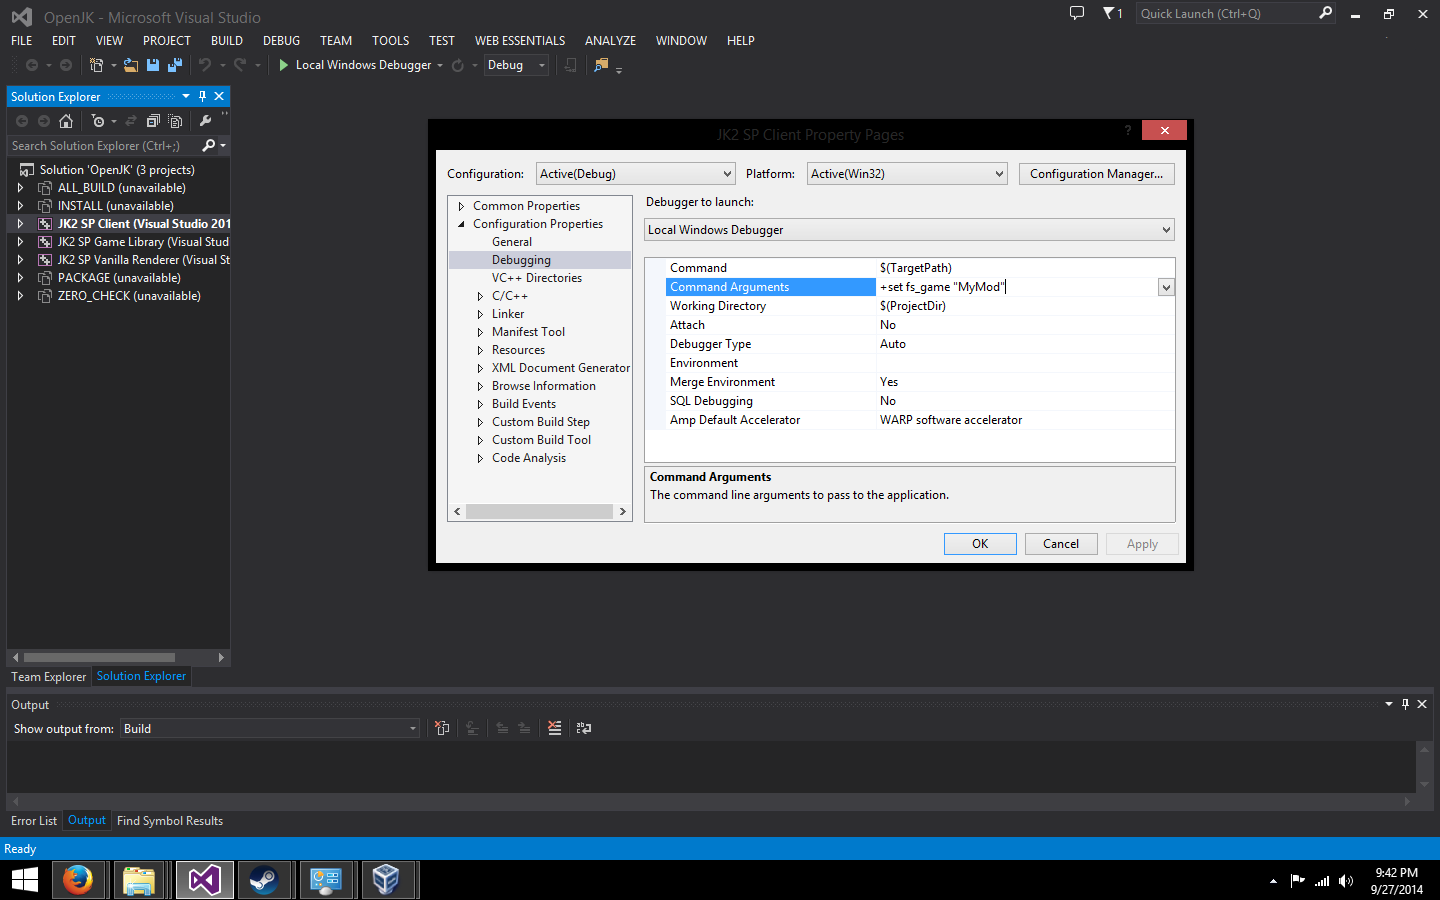
If you'd like to add any extra options (fs_game for instance), you can alter those in Project Properties > Debugging > Command Arguments. This works the same way as it would in a .bat file. You will also need to set fs_basepath to point to your Gamedata folder (not pictured)
Your Debugging Toolbox
Congratulations! By clicking on the green arrow at the top of the main window, you can now launch your game using the green "Start" arrow at the top of the screen (or by pressing F5).
I'll take the time to now explain some of the key features of most debuggers.
But first, some vocabulary specific to debugging:
- Breakpoint: A place where an interruption is made.
- Instruction Pointer: The next instruction that will be executed by the program
- Call Stack: A trace of how the instruction pointer reached its destination by scanning the previous functions
Breakpoints
Breakpoints are one of the most powerful, if not the most powerful tool in your arsenal. By right-clicking a line, you can insert a breakpoint with Breakpoint > Insert Breakpoint. A small red circle should appear to the left of the line. I'm going to put one in Com_Printf (common.cpp, in the engine) now, as a simple example. Let's go ahead and run the program. Make sure you are always compiling before debugging!
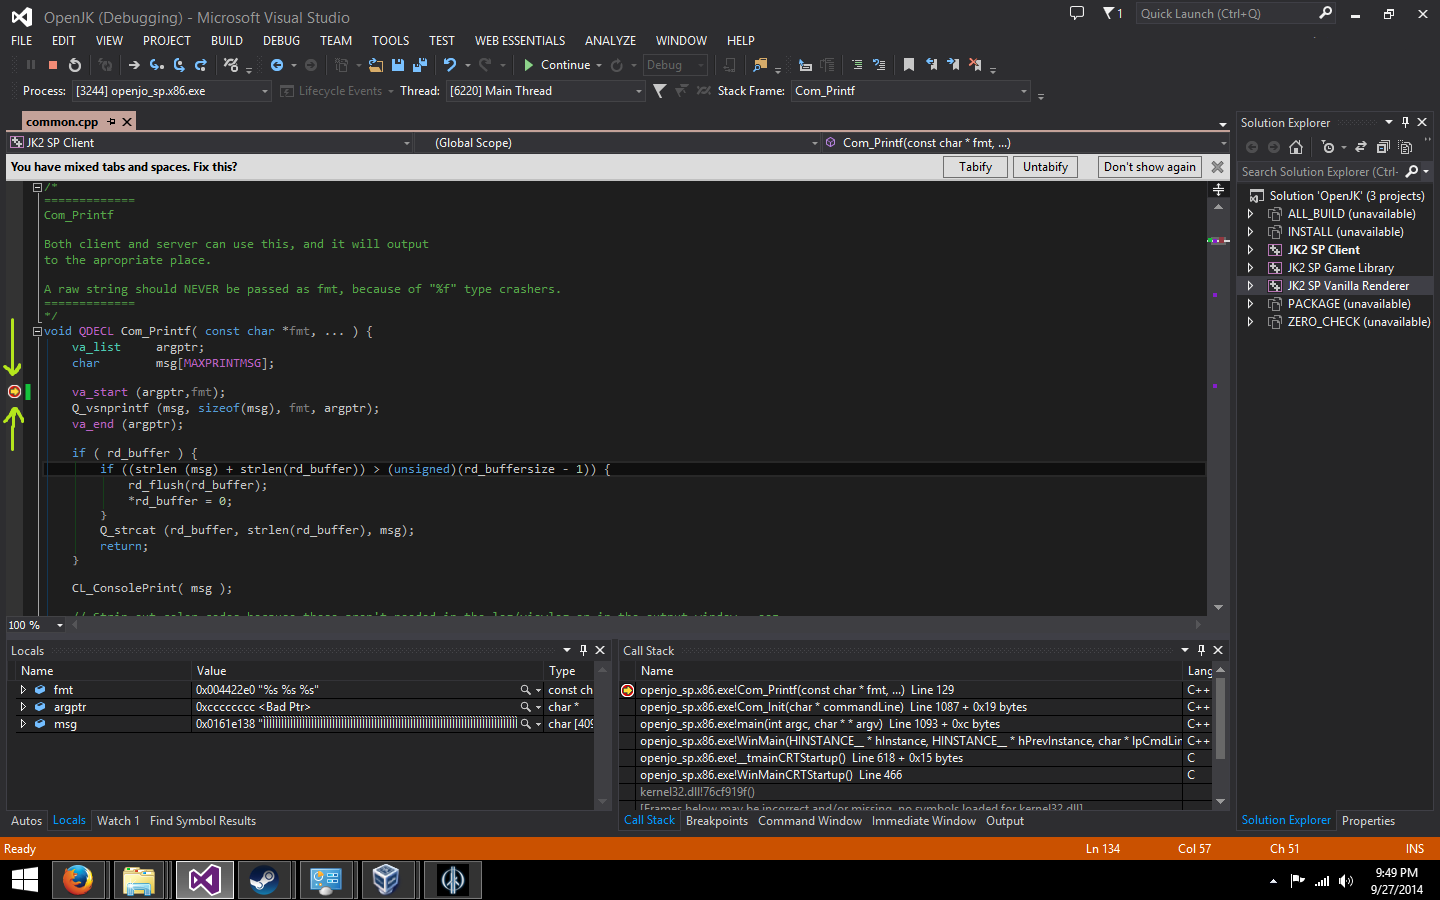
As you can see, the program has stopped once the game has tried to print something. I will go over the other panels (your display may be different) later. In this paused state, we can change code, check variables at that specific point in time (see the Locals tab below), add or remove breakpoints, alter the current value of any variables (use this with extreme caution), and more.
You can configure a breakpoint to have more specific options. By right clicking on the breakpoint, we can alter different aspects of the breakpoint.
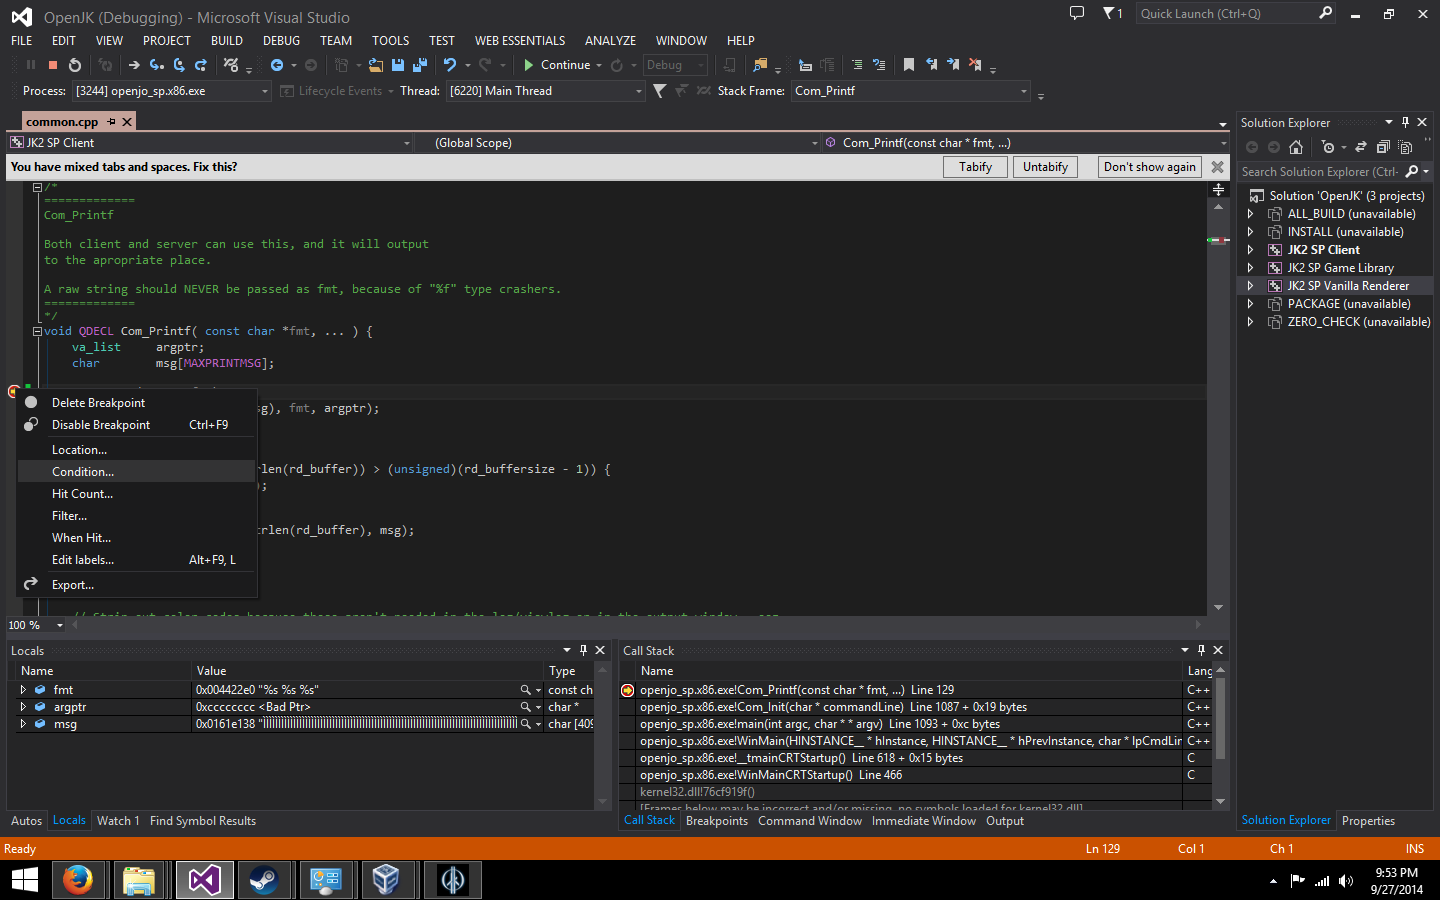
- Delete Breakpoint: Removes the breakpoint
- Disable Breakpoint: Disables the breakpoint, but doesn't delete it. The breakpoint can then be reinstated by going to the breakpoints panel and turning it back on.
- Location: Changes the location of the breakpoint.
- Condition: Allows you to attach a condition to the breakpoint. For instance, you can check the value of a variable. Think of it as an if statement, but for your breakpoints. (NOTE: degrades performance)
- Hit Count: Here, you can view the number of times the breakpoint is hit. You can also have the debugger ignore the breakpoint, and only trip it if that line of code has been executed a certain number of times.
- Filter: Not important, as the game is not properly multithreaded.
- When Hit: You can choose to have the debugger print a message in the Output panel instead of actually breaking.
- Edit Labels: Allows you to attach a label to a breakpoint, so it has a more descriptive name in the Breakpoints panel.
Step Over/Step Into/Step Out
These commands allow you to "step through" the program as it is being run. You can see for instance, how a particular function plays out. Here is an explanation of what each one does:
- Step Over: Executes the current statement, and brings the instruction pointer further. If the instruction pointer is currently at the end of the function, it will also perform a Step Out.
- Step Into: If the current statement has a function, step into that function.
- Step Out: Executes the rest of the code past the instruction pointer for that function, and stops once the instruction pointer has reached the outside of the function.
Let's continue with the current example. By stepping over twice, the program has executed two more instructions, and the instruction pointer has moved forward two steps. Those two steps modified variables msg and argptr, so note the difference in their values compared to the screenshot above. Since the last instruction modified msg, that variable is now highlighted in red in the Locals panel.

Run to Cursor
By right clicking a line and selecting this option, the program will execute until it reaches that point. Think of it as a temporary breakpoint, meant to save you the extra step of having to delete it.
Variable Control and Monitoring
When you are debugging, you will need to keep track of many different variables. Fortunately, there are several tricks and tools that you can use to make things easier. I have already shown you the Locals panel, which keeps track of all local variables within a function. There are also two other methods which are effective at keeping track of a variable's value.
The first (and easiest) way to get the value of a variable is by simply hovering over it in the code display:
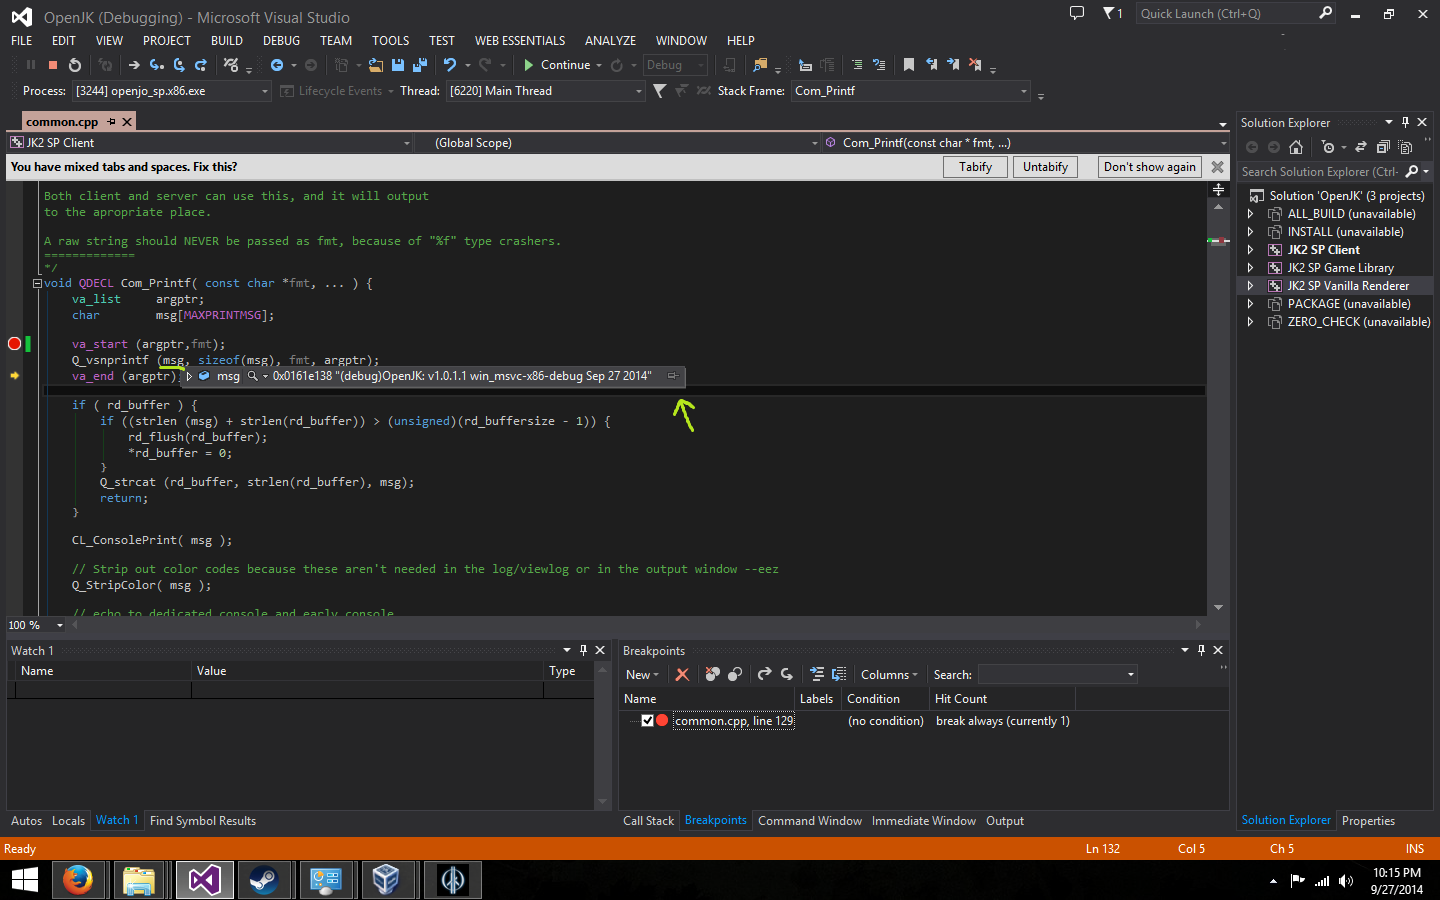
If you want to modify the value of a variable, you can do so by clicking on the value and changing it (and pressing Enter). This is not recommended.
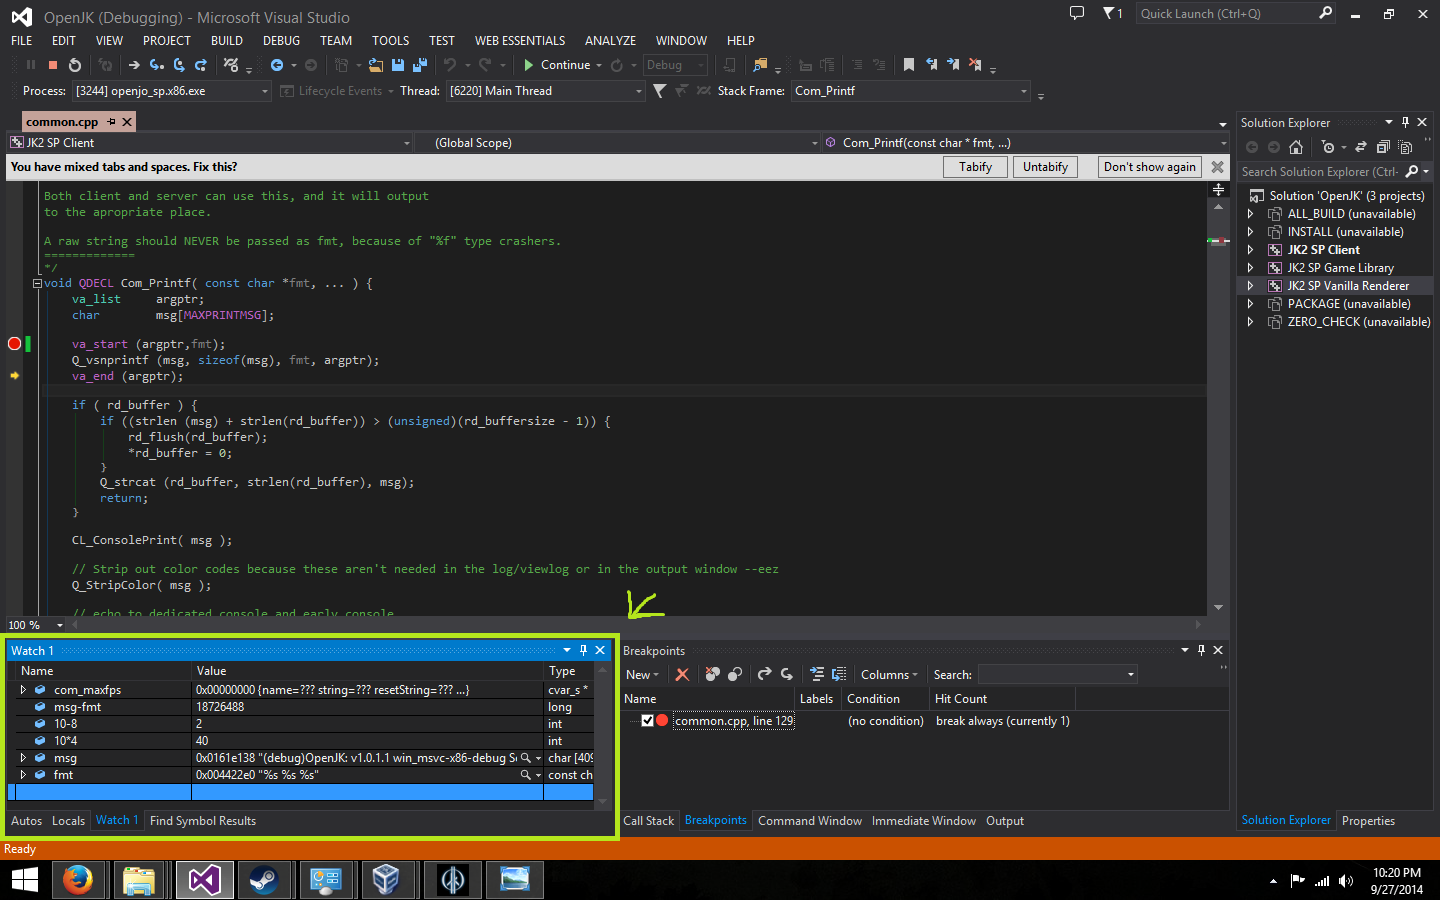
The second way is to use a Watch. Watches are great for global variables, as they aren't specific to a scope. There's two ways to add a Watch. You can either enter the variable name into the Watches panel, or right click on the variable and Add Watch. The Watch panel is also good because it serves as an expression parser, and you can perform various math operations on variables within the Watch. Some examples:
Call Stack
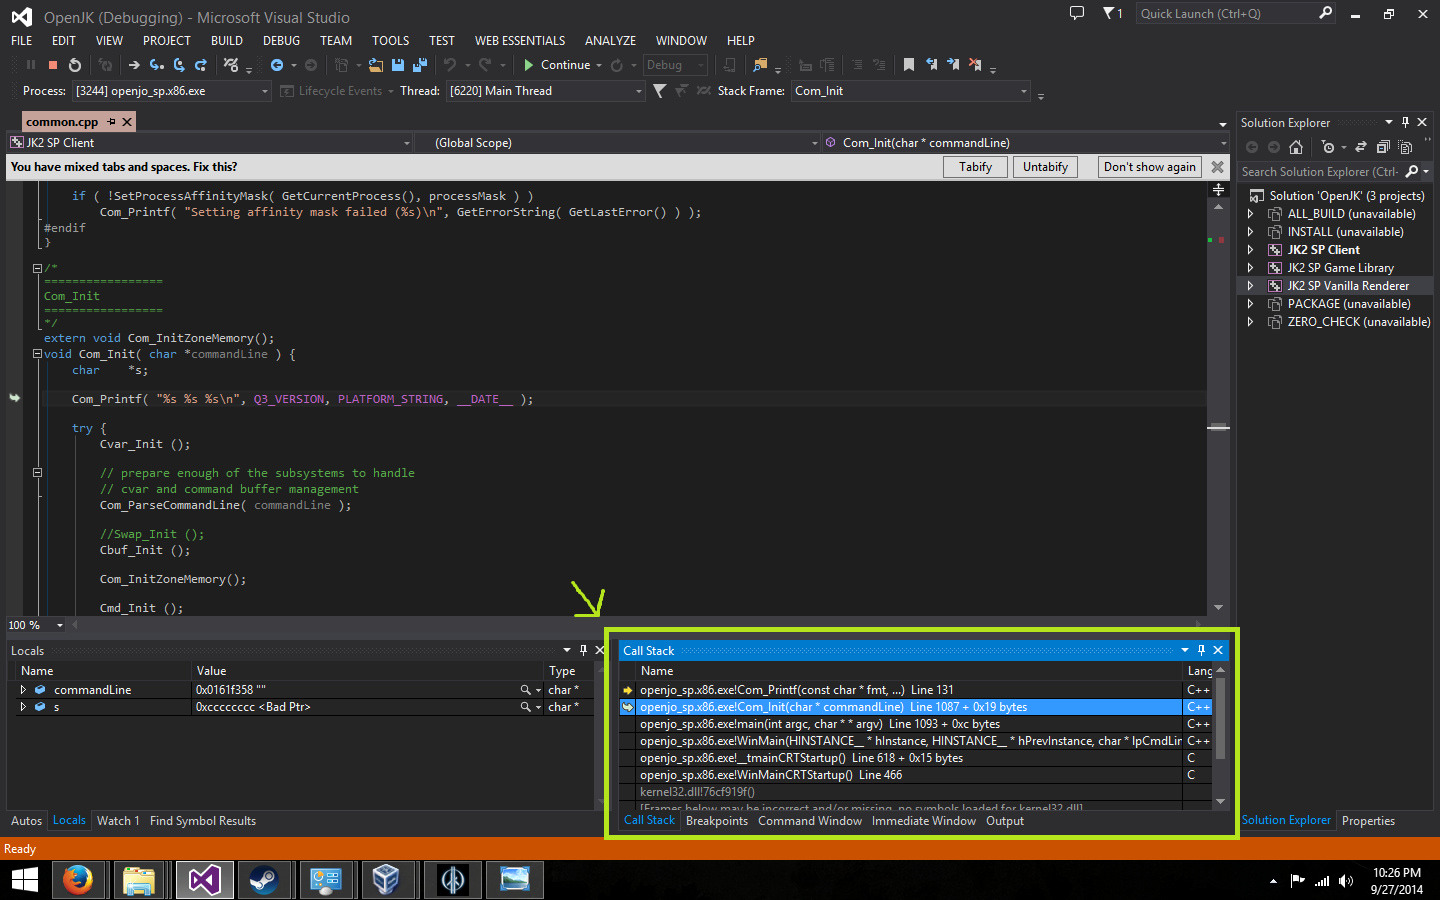
The call stack is a useful tool that allows you to see where your code was called from. So, in our example, I can crawl back up to Com_Init where it was called, by going to the call stack and selecting the second option. The call stack is always displayed in reverse order.
Most Common Errors
Now that you've got (more or less) all the tools you need to start debugging, let's examine a few common errors.
Unhandled Exception: Access Violation (c00000005)
This is the most frequent crash you'll encounter in all of your programming in C and C++. Basically, you're trying to dereference a null pointer. Take this code for instance:
gentity_t *alwaysNull = nullptr; // or NULL
alwaysNull->s.clientNum = 0;
The second line will cause a crash, since alwaysNull is a pointer to a null spot in memory. Trying to therefore access s would cause a crash, since you're outside the bounds of the normal program's memory. (You're violating the access that your program is allowed to have, hence the Access Violation.)
Stack Overflow
There's too many entries in the call stack. One of the most frequent causes of this is calling a function within itself (using a principle known as recursion), and not providing an exit case for the function to stop running. That's a lot of words that might not make a lot of sense if you're a beginner, so here's an example of what I'm referring to:
void MyFunction(int x) {
    MyFunction(x);
}
If you were to call MyFunction(100), this code would cause a stack overflow. If you look at the call stack, you can see why: MyFunction is calling itself over and over again without a way to escape! Generally recursion should be carefully used (and ideally, as little as possible) to avoid issues of stack overflow. While it's possible that stack overflow may occur for other reasons besides faulty recursion, it's not common.
Assertion Failure
By using an assert() statement, you can assert that something ought to be true. For example:
assert(a == b);
This code will assert that a and b are equal to each other. But what happens if they are not equal to each other? Well, in a release or final build of the game, nothing at all will happen. But in a debug build of the game, you'll likely get a message box asking to abort, retry or ignore, stating that the assertion failed. Asserts are a tool that lets you know if something that shouldn't happen, does happen, without using conditional breakpoints which may slow down your performance greatly.


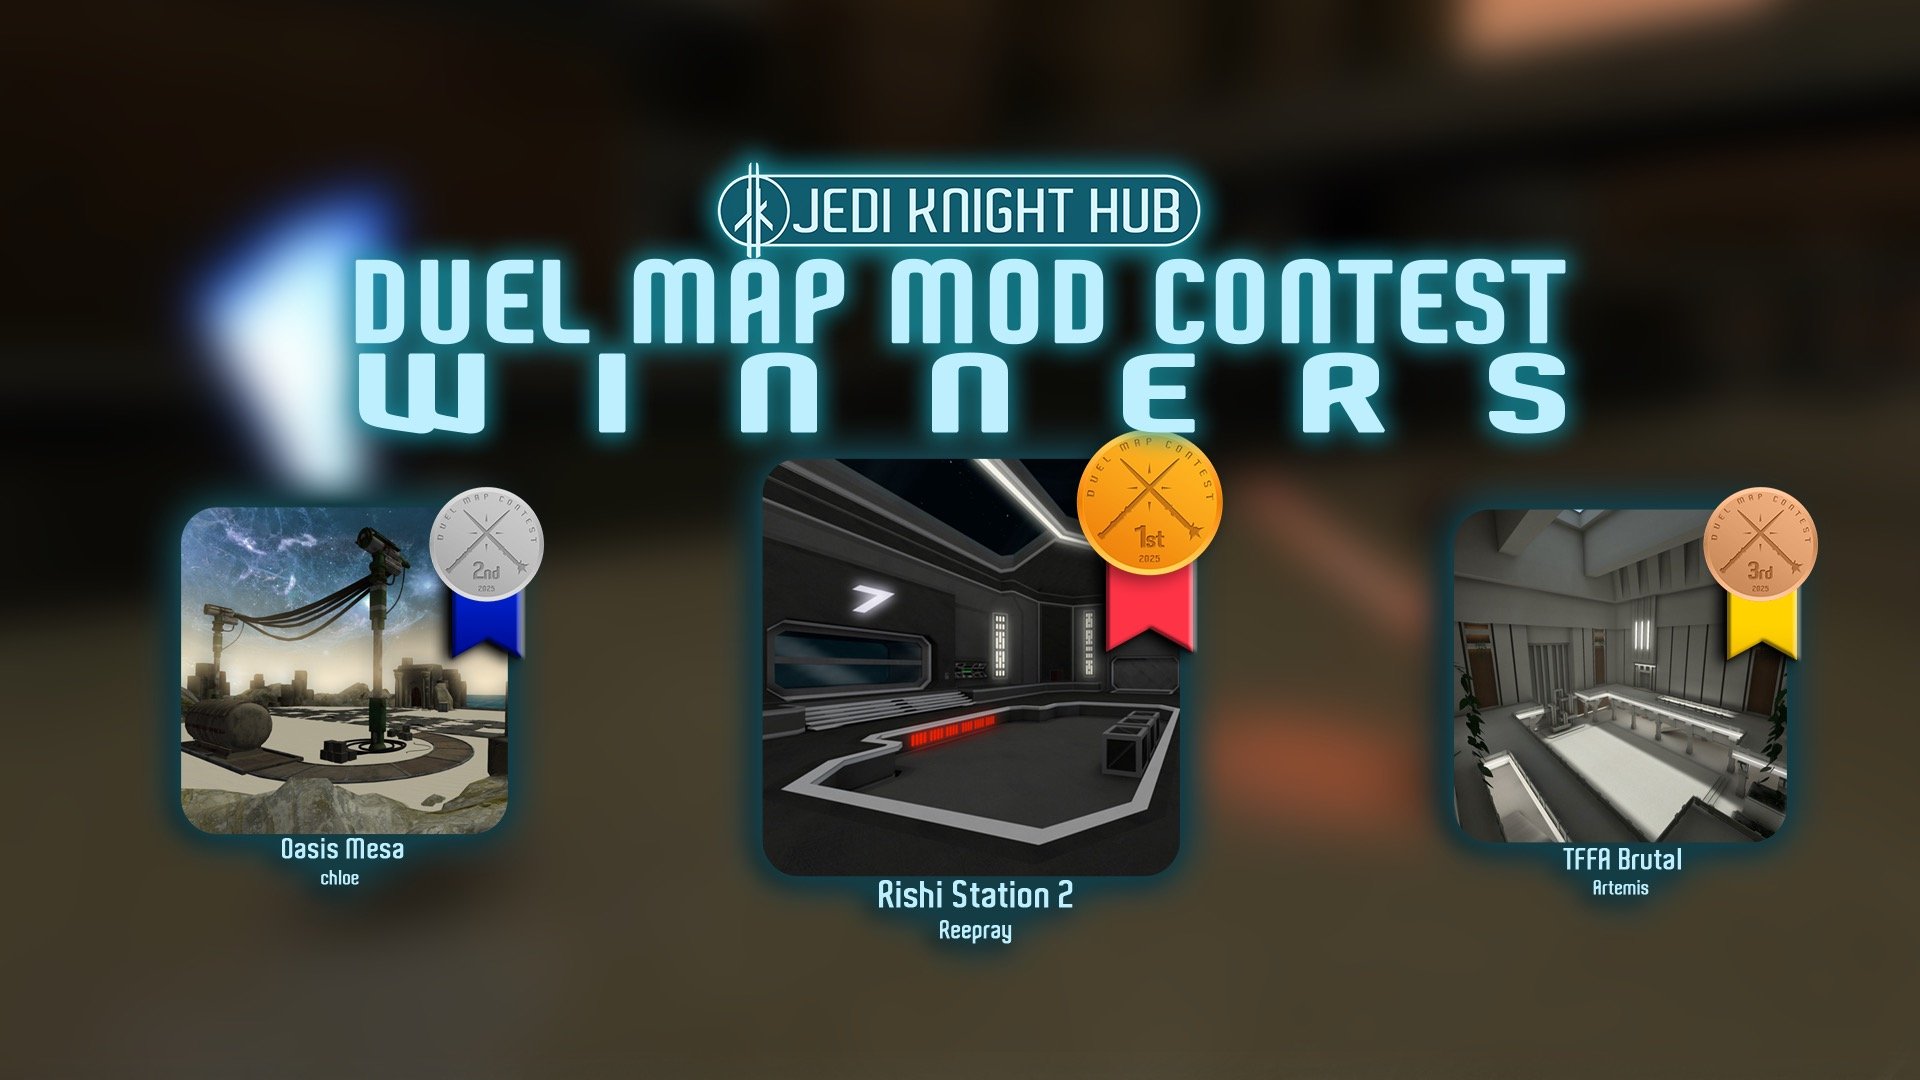
 1st Place Winner Reepray with Rishi Station 2,
  2nd Place Winner chloe with Oasis Mesa, and
  3rd Place Winner Artemis with TFFA Brutal! Amazing submissions by everyone!


Recommended Comments
Create an account or sign in to comment
You need to be a member in order to leave a comment
Create an account
Sign up for a new account in our community. It's easy!
Register a new accountSign in
Already have an account? Sign in here.
Sign In Now